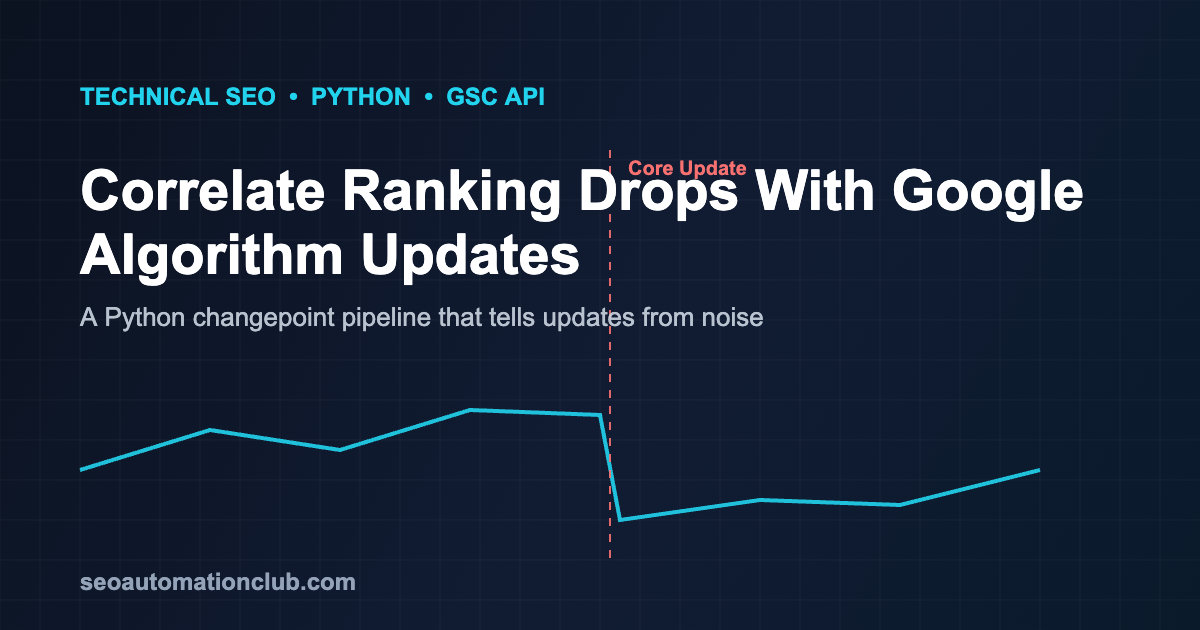
Correlate Ranking Drops With Google Algorithm Updates: A Python Pipeline That Tells Updates From Noise
Every SEO who has watched traffic slide has asked the same question: was that Google, or was it me? A confirmed core update lands the same week you shipped a template change, pruned forty thin pages, and consolidated a subdirectory. Three suspects, one crime scene, and the usual verdict is a shrug and a hunch. That guesswork does not scale past a handful of pages, and it collapses entirely on a 5,000-URL site where different sections react to the same update in opposite directions.
This guide builds an automated attribution pipeline in Python. It pulls daily Search Console data, detects statistically real changes instead of noise, and joins those changes to a maintained timeline of Google updates — so you end up with a defensible answer rather than a vibe. The same machinery doubles as an early-warning system: when a section moves, you know within a day whether an update coincided with it.
Why manual update attribution breaks down
Eyeballing a traffic chart fails for three predictable reasons. First, recency bias: whatever you remember doing gets the blame, and quiet changes (a CDN config, an internal-link refactor) never make the suspect list. Second, aggregation hides the story. Sitewide clicks can look flat while your money pages crater and your blog quietly absorbs the difference. Third, Google updates roll out over days or weeks, not on a single date, so the “drop” you see rarely lines up cleanly with the announcement.
Who outranks you, and for which keywords? Get a free automated audit of your site, delivered to your inbox as a PDF.
Audit my site freeAttribution done properly is a data problem, not a memory problem. You need per-segment time series, a rigorous definition of “a real change,” and a timeline you can join against. Let us build each layer.
The pipeline in four layers
1. Pull daily performance data from the Search Console API
The Search Analytics endpoint gives you clicks, impressions, CTR, and average position by day. Query it per page group rather than sitewide so you can see divergence. Use the date dimension and a stable set of URL filters that map to your site sections.
from googleapiclient.discovery import build
from google.oauth2.credentials import Credentials
import pandas as pd

def fetch_segment(service, site, start, end, url_regex):
    body = {
        'startDate': start,
        'endDate': end,
        'dimensions': ['date'],
        'dimensionFilterGroups': [{
            'filters': [{'dimension': 'page',
                         'operator': 'includingRegex',
                         'expression': url_regex}]
        }],
        'rowLimit': 25000,
    }
    rows = service.searchanalytics().query(siteUrl=site, body=body).execute().get('rows', [])
    df = pd.DataFrame([{
        'date': r['keys'][0],
        'clicks': r['clicks'],
        'impressions': r['impressions'],
        'position': r['position'],
    } for r in rows])
    return df.sort_values('date').reset_index(drop=True)
Pull at least sixteen months so you have seasonal context (GSC retains roughly that window). Store the raw daily rows; you will re-run detection as new updates are confirmed, and you do not want to be re-querying history each time.
2. Treat the update timeline as data, not memory
Keep a small, version-controlled file of confirmed Google updates with a start and end date, because rollouts are windows. This is the single most valuable and most neglected asset in the whole pipeline.
updates = pd.DataFrame([
    {'name': 'March 2024 Core Update',  'start': '2024-03-05', 'end': '2024-03-19', 'type': 'core'},
    {'name': 'August 2024 Core Update', 'start': '2024-08-15', 'end': '2024-09-03', 'type': 'core'},
    {'name': 'December 2024 Core',      'start': '2024-12-12', 'end': '2024-12-18', 'type': 'core'},
    # append new confirmed updates here as Google announces them
])
updates['start'] = pd.to_datetime(updates['start'])
updates['end']   = pd.to_datetime(updates['end'])
Detect real changes with changepoint detection
Why fixed thresholds lie
The naive approach — “alert if clicks drop 20% week over week” — produces a flood of false positives on volatile pages and stays silent on a slow, permanent decline that never trips the threshold in any single week. A page that swings 30% on weekends should not fire; a page that steps down 12% and never recovers absolutely should. What you actually care about is a persistent shift in the level of the series, and that is precisely what changepoint detection finds.
A practical changepoint pass
The ruptures library implements several algorithms; for this use case, the PELT method with an RBF cost is a reliable default. Detect on impressions or clicks, then translate each breakpoint back into a date.
import ruptures as rpt
import numpy as np

def find_changepoints(df, column='impressions', penalty=10):
    signal = df[column].to_numpy().astype(float)
    if len(signal) < 30:
        return []
    algo = rpt.Pelt(model='rbf', min_size=7).fit(signal)
    bkps = algo.predict(pen=penalty)          # indices, last one is len(signal)
    dates = []
    for idx in bkps[:-1]:
        before = signal[max(0, idx-14):idx].mean()
        after  = signal[idx:idx+14].mean()
        delta  = (after - before) / before if before else 0
        dates.append({'date': pd.to_datetime(df['date'].iloc[idx]),
                      'delta_pct': round(delta * 100, 1)})
    return dates
Tune penalty per segment: a higher value means fewer, more confident breakpoints. Run detection on each segment independently — a global penalty on noisy and calm series alike is how you drown in alerts.
Attribute changepoints to updates
Now join. For each detected changepoint, look for an update window whose dates fall within a tolerance of the break. Because rollouts are windows and GSC data has its own two-to-three-day reporting lag, allow a buffer — typically a few days on either side.
def attribute(changepoints, updates, tolerance_days=5):
    out = []
    for cp in changepoints:
        match = None
        for _, u in updates.iterrows():
            lo = u['start'] - pd.Timedelta(days=tolerance_days)
            hi = u['end']   + pd.Timedelta(days=tolerance_days)
            if lo <= cp['date'] <= hi:
                match = u['name']
                break
        out.append({**cp,
                    'attributed_to': match or 'unexplained',
                    'likely_self_inflicted': match is None})
    return out
The output is the useful part: every meaningful shift is now labeled either with an update name or flagged unexplained. An unexplained drop is a lead, not a dead end — it points you at your own deploy log, a tracking break, or a technical regression.
Rule out the confounders
Attribution is only credible if you actively exclude the alternatives. Three matter most. Seasonality: compare the change against the same window a year earlier before you blame an update; a February dip in tax-software content is a calendar, not a core update. Your own changes: keep a deploy and content-ops log with dates so an “update” coincidence can be checked against a migration or a pruning batch. Remember that fixes and mistakes alike take time to register — see our breakdown of the lag between an editorial change and its algorithmic effect. Internal competition: a “drop” on one URL is sometimes another URL of yours winning the same query, which our guide to keyword cannibalization detection will surface.
From attribution to action
A labeled changepoint table changes what you do next. When a core update is the confirmed cause of a broad, section-wide decline, the response is content quality and helpfulness — not a frantic technical audit. Pair the attribution output with an LLM content-quality scorer aligned to the Quality Rater Guidelines to prioritize which affected pages to rewrite first. When a change is flagged unexplained, you route it to engineering instead: the timing points at a release, and the fix is usually a regression, not a rewrite. That routing decision — quality work versus technical work — is the entire payoff of doing attribution rigorously, and it is impossible to make honestly by staring at a chart.
Schedule the pipeline to run daily, append fresh GSC rows, re-run detection on a trailing window, and post any new attributed changepoint to Slack. Over a quarter you accumulate an audit trail that answers “what did this update do to us, by section?” in seconds — the question that used to eat an afternoon and still ended in a guess.
Frequently asked questions
Do I need machine learning to detect changepoints?
No. Changepoint detection is a classical statistical method, not deep learning. Libraries like ruptures run in milliseconds on a year of daily data, and the logic — find where the level of a series shifts persistently — is transparent and auditable, which matters when you are attributing revenue impact.
How far from an update date can a change still be attributed?
Core updates roll out over one to three weeks, and Search Console data lags reality by two to three days. A tolerance of roughly five days on either side of the announced window captures most legitimate matches without pulling in unrelated shifts. Widen it and you invite false attribution; tighten it and you miss late-rollout effects.
Why segment by URL group instead of analyzing the whole site?
Because updates are rarely uniform. A single core update can lift your editorial content while suppressing thin programmatic pages, and a sitewide average cancels the two out to look like “no change.” Segment-level detection is the only way to see who actually moved and why.
What if a drop is flagged unexplained?
Treat it as a high-value lead. An unexplained persistent drop usually traces to something you control: a deploy, a broken tag, a canonical or noindex regression, or an internal-link change. Cross-reference the changepoint date with your deploy log first.
Who outranks you, and for which keywords?
Get a free audit that maps your search visibility, your top competitors and the keyword gaps worth targeting next.
Rather have it handled for you? See Donna’s plans →