n8n Workflow Status: How to Monitor, Alert, and Check Executions Remotely
You built the n8n workflows. They pull Search Console data, rewrite meta descriptions, chase lost backlinks, and file reports while you sleep. The problem with automation you never watch is that it fails the same way: quietly. A credential expires, an API returns a 429, a node throws on a malformed row, and the workflow simply stops. Nothing breaks loudly. You only notice weeks later when the weekly report never arrived and a competitor has out-ranked a page you thought you were monitoring.
This guide covers how to make n8n observable: how to know, in real time and from your phone, whether every scheduled workflow ran, succeeded, and did what it was supposed to. It is written for the self-hosted, SEO-heavy n8n setups most of this site runs on, but the patterns apply to n8n Cloud too. Along the way you get a repeatable way to check n8n workflow status — active or paused, last run, and whether the most recent execution succeeded — without opening a laptop.
How to check n8n workflow status right now
Before building alerting, it helps to know the places n8n already exposes workflow status — whether a workflow is active, when it last ran, and whether that run succeeded or failed. Each answers a slightly different question, and the right one depends on whether you are at your desk, on your phone, or wiring status into another system.
Want to know where your own site stands? Get a free automated audit of your site, delivered to your inbox as a PDF.
Audit my site free| Where to check status | What it tells you | Best for |
|---|---|---|
| Workflows list → Active toggle | Whether the workflow is armed and its trigger is live (active vs. inactive) | Confirming a schedule or webhook is actually enabled |
| Executions tab (editor) | Every run with a Success, Error, or Running badge, plus start time and duration | Reading recent run history and opening a failed run to debug |
GET /rest/executions (internal API) |
JSON list of executions with finished, status, and stoppedAt fields |
Feeding status into a dashboard, script, or another workflow |
/healthz + /metrics endpoints |
Whether the n8n instance itself is up and how many executions are queued or failing | Instance-level health and remote/mobile checks |
The editor tabs answer “did this specific run work?” The API and endpoints answer “is everything still running?” — the question you actually want answered at 2 a.m. The three layers below turn those manual checks into alerts that reach you instead of waiting for you to look.
The three layers of n8n observability
Monitoring n8n is not one thing. It is three separate questions, and most people only answer the first:
- Did the workflow run? Scheduled triggers can silently stop firing if the instance restarts, the queue backs up, or the container is killed. This is the layer people forget.
- Did it succeed? A workflow can run to completion and still be wrong: an HTTP node returns 200 with an error body, an expression evaluates to
undefined, or a branch you expected never executes. - Did it do the right amount of work? A backlink monitor that normally processes 400 rows and suddenly processes 3 has not failed, but something upstream has. Volume anomalies are the earliest warning sign.
A real monitoring setup answers all three. Below, each gets its own mechanism.
Layer 1: catch failures with an Error Trigger workflow
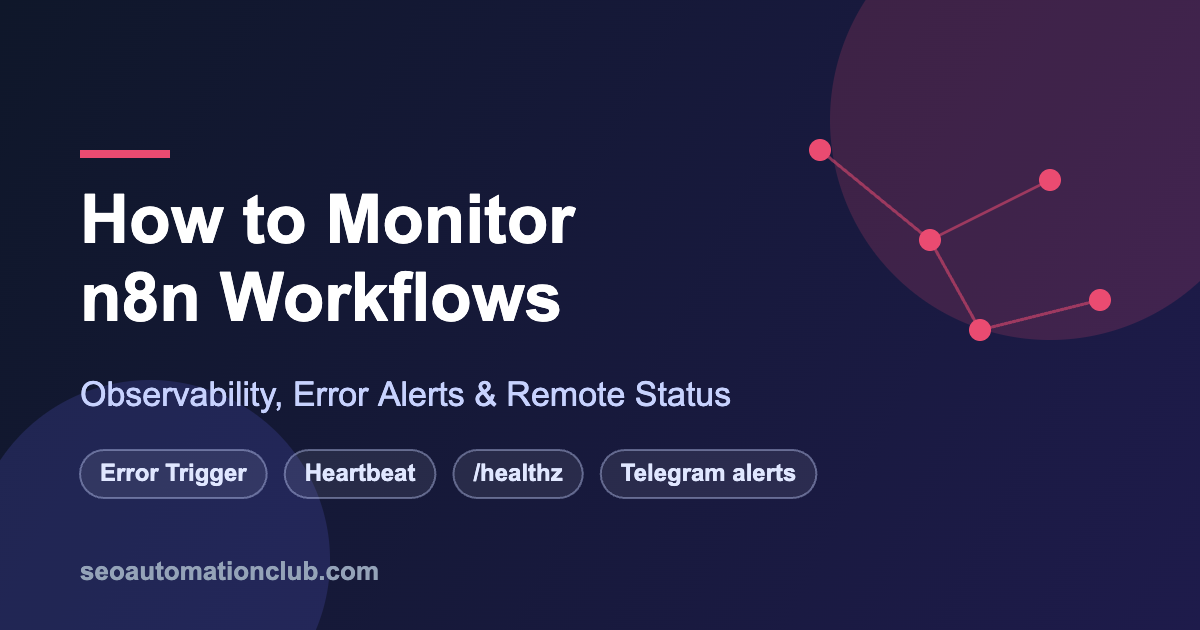
n8n has a built-in mechanism most tutorials skip: the Error Trigger node. Create one dedicated workflow that starts with an Error Trigger, then open every other workflow’s Settings → Error Workflow and point it at that workflow. Now any unhandled exception, anywhere, routes to a single place.
Inside that error-handler workflow, the Error Trigger passes a rich JSON object: workflow.name, execution.id, the failing node, and the error message. Feed those into a Slack or Telegram node and you get an alert that tells you exactly what to open:
Workflow: {{$json.workflow.name}}
Node: {{$json.execution.lastNodeExecuted}}
Error: {{$json.execution.error.message}}
Open: {{$env.WEBHOOK_URL}}/workflow/{{$json.workflow.id}}/executions/{{$json.execution.id}}
Telegram is the better channel for a solo operator: alerts arrive as push notifications on your phone, and the deep link opens the exact failed execution when you tap it. This is the same alerting pattern used in our Core Web Vitals monitoring pipeline, just wired into n8n’s native error routing instead of a Python script.
Layer 2: prove the workflow actually ran (the heartbeat)
An Error Trigger only fires when something throws. It cannot tell you that a scheduled workflow stopped firing entirely — because a workflow that never runs never errors. This is the single most common silent failure in self-hosted n8n, and it needs an external watchdog.
The pattern is a dead man’s switch. Add a final HTTP Request node at the end of each critical scheduled workflow that pings a monitoring service every time it completes successfully. Free services like Healthchecks.io or a self-hosted Uptime Kuma instance expect that ping on a schedule; if the ping does not arrive within the grace period, they alert you.
The logic inverts your dependency: instead of trusting n8n to report its own death, an independent system notices the silence. A workflow scheduled every morning at 07:00 should ping by 07:10; if 07:10 passes with no ping, you get a notification that the run is missing — even if the entire n8n container is down.
Configure the check interval to match the schedule and set a grace period roughly equal to the workflow’s normal runtime plus a buffer. For a workflow that takes two minutes, a ten-minute grace period catches genuine failures without firing on ordinary slowness.
Layer 3: watch the health endpoint and execution volume
Self-hosted n8n exposes a /healthz endpoint that returns HTTP 200 when the instance is up. Point any uptime monitor — UptimeRobot, Better Stack, or the same Uptime Kuma instance — at https://your-n8n-domain/healthz on a one-minute interval. This is your coarsest but most reliable signal: if the endpoint goes dark, the whole instance is down and every workflow with it.
For deeper visibility, enable n8n’s metrics. Setting N8N_METRICS=true exposes a Prometheus-compatible /metrics endpoint with counters for total executions, failures, and active workflows. Scrape it with Prometheus and you can graph execution success rate over time and alert on ratios — for example, when failures exceed five percent of runs in an hour. If you run n8n in queue mode with a separate worker, also watch the Redis queue depth: a growing backlog means workers cannot keep up and executions are being delayed, not lost.
Volume anomalies are worth a dedicated check. Query the n8n execution database (or the REST API at /rest/executions) for the row count your workflow last processed, compare it to a rolling average, and alert when it deviates sharply. This is exactly how a backlink monitoring pipeline catches an upstream API quietly returning partial data long before the numbers show up wrong in a report.
Monitoring n8n from your phone
Remote and mobile status is mostly a matter of routing every signal above into a channel your phone already pushes. Three practical options:
- Telegram bot: the lowest-friction option. Error alerts, heartbeat misses, and a nightly “all workflows green” summary all land as push notifications. You can even add a command handler so texting
/statusto the bot triggers a workflow that queries recent executions and replies. - Uptime Kuma mobile: its status page is mobile-friendly and it can push to Telegram, Discord, or a native app, giving you a single dashboard of every
/healthzand heartbeat check. - A lightweight status workflow: schedule a workflow that hits
/rest/executions, counts failures in the last 24 hours, and posts a one-line digest each morning. Green digests build trust; their absence is itself a signal.
The goal is not more dashboards. It is being able to answer “is everything running?” from a lock screen in five seconds.
A minimal monitoring stack that covers all three layers
You do not need Prometheus and Grafana on day one. A setup that catches virtually every real failure mode is deliberately small: one Error Trigger workflow routing to Telegram (catches exceptions), a Healthchecks.io ping at the end of each scheduled workflow (catches missed runs), and an UptimeRobot check on /healthz (catches instance death). That is three moving parts, all on free tiers, and together they answer all three observability questions.
Add Prometheus metrics and volume anomaly detection later, once the workflows themselves are stable and you want trend data rather than just pass/fail alerts. If you are still deciding whether n8n is the right home for these workflows at all, our teardown of n8n vs Make vs Zapier covers how self-hosting changes the monitoring burden — on hosted platforms you trade control for someone else’s uptime, but you also lose /healthz and /metrics.
Frequently asked questions
How do I check the status of an n8n workflow?
Open the Executions tab to see each run tagged Success, Error, or Running, and check the Active toggle on the Workflows list to confirm the trigger is live. For status you can use programmatically, call GET /rest/executions and read the status and finished fields, or hit /healthz for instance health. To get n8n workflow status pushed to your phone instead of pulling it, wire an Error Trigger and a heartbeat as described above.
Does n8n have built-in monitoring?
Partially. n8n includes an Error Trigger node for routing failures, an execution list in the UI, a /healthz health endpoint, and an optional Prometheus /metrics endpoint enabled with N8N_METRICS=true. It does not, however, alert you when a scheduled workflow stops firing — that requires an external heartbeat monitor.
How do I get alerted when an n8n workflow fails?
Create one workflow that begins with an Error Trigger node and connects to a Slack or Telegram node. Then, in every other workflow’s Settings, set that workflow as the Error Workflow. Any unhandled error will route there and push you an alert with the workflow name, failing node, and a deep link to the execution.
How do I monitor n8n workflows remotely or from mobile?
Route alerts to Telegram or a mobile-friendly status page like Uptime Kuma. For proactive checks, point UptimeRobot at your /healthz endpoint and use a dead man’s switch (Healthchecks.io) that pings on each successful run, so a missed run pushes a notification to your phone.
What is a dead man’s switch in n8n?
It is an external service that expects a regular ping and alerts you when the ping stops. You add an HTTP node at the end of a scheduled workflow to send that ping on success. Because the alert fires on silence rather than on error, it catches the case where the whole workflow — or the entire n8n instance — stops running.
Can I monitor self-hosted n8n with Prometheus and Grafana?
Yes. Set N8N_METRICS=true to expose a Prometheus-compatible /metrics endpoint, scrape it with Prometheus, and visualize execution counts, failure rates, and active workflows in Grafana. In queue mode, also monitor Redis queue depth to detect worker backlogs.
Want to know where your own site stands?
Get a free automated SEO audit: technical health, speed, AI-search readiness and competitors, delivered as a PDF action plan.
Rather have it handled for you? See Donna’s plans →